A very interesting review to look at the overall US economy.
KEY POINTS:
- 2012 has been a year of modest growth for the US economy, although the economy has held up well despite troubles in the Eurozone alongside a slowing of growth in China
- Jobs have continued to be created while the housing market appears to be on track for recovery
- The Federal Reserve has kept monetary policy accommodative, embarking on two rounds of quantitative easing in 2012 so far
- While outstanding mortgage debt continues to shrink, consumer credit has begun to expand, suggesting that the credit cycle is turning and consumers are beginning to spend again
- Investment has been weighed down by conservatism in the corporate sector, although the recovery of housing construction should continue to provide a positive boost
- Going into 2013, we continue to see housing as a bright spot for the US economy, which has positive implications for consumer spending, with the “wealth effect” of rising home prices offsetting some of the damage from the “fiscal cliff” situation
- A revival of the credit cycle is also a positive for consumers, while the corporate sector remains in good shape with record high profits as companies benefit from conservative hiring, a low interest rate environment and minimal tax implications from the “fiscal cliff”
- While some investors are often obsessed with short term events and news, we maintain our preference for a focus on earnings, which have had a strong relationship with the growth in stock prices over time
- 2013 may yet surprise on the upside as companies deliver another year of record-high profits, while low valuations mean the US market still remains attractive at present
A REVIEW OF 2012
Not Too Hot, Not Too Cold
| CHART 1: US ECONOMY STILL HUMMING ALONG |
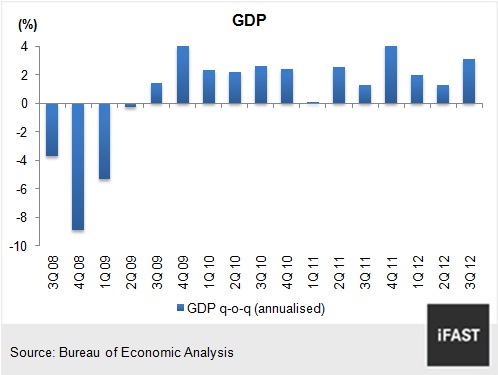 |
To cite an overused cliché, 2012 has been a “Goldilocks” year for the US economy – growth has neither been too fast nor too slow, although some may argue that 2.2% growth (forecasted for 2012 by the consensus) for the world’s largest single-country economy should hardly be considered “just right”, in view of the severity of the 2008-2009 recession. Still, given that global growth in 2012 has been fairly muted owing to a recession in the Eurozone alongside a significant deceleration of growth in China, the US economy clearly stands out for its ability to hum along despite the many external woes, with resilient domestic demand and sustained investment likely to see the US economy post acceleration from 2011’s fairly modest 1.8% full-year growth.
| CHART 2: GROWTH CONTRIBUTORS |
 |
Jobs, Housing Situation Improving
| CHART 3: PAYROLLS STILL INCREASING |
 |
| CHART 4: HOUSING ACTIVITY HAS BOTTOMED |
 |
Improvements have been observed in various aspects of the US economy, with job creation continuing (albeit at a modest rate, see Chart 3) on a monthly basis while consumer spending has remained resilient. Since nonfarm payrolls turned positive in March 2010, cumulative payrolls have seen over 4 million jobs added back to the labour force, although this still pales in comparison with the 8.8 million jobs lost over the 2008-2009 economic downturn and suggests that the job recovery still has some way to go. As with our forecasts earlier this year (see “How This Overlooked Sector Can Double US GDP Growth (Part 2)”), the US housing market appears to have finally turned the corner, with prices appearing to have bottomed and housing starts rising to a four-year high in October (an 894,000 annual rate, see Chart 4), although still below our forecasts of a more normalised rate (~1.3 million).
Monetary Policy Has Remained Accommodative
Still, the Federal Reserve has remained cautious on economic conditions, and in September 2012, opted for a third round of quantitative easing measures (dubbed “QE3”) via the additional purchase of agency mortgage-backed securities to the tune of USD40 billion per month, with no fixed ending date given except that such action would be done “until improvement is achieved in a context of price stability”. In the December 2012 FOMC meeting, the Fed announced that it would purchase USD45 billion of long-term US Treasury bonds, with purchases running concurrently to the previously-announced mortgage security purchases. For the first time, the Fed also disclosed “quantitative” measures of economic performance with regards to the continuation of its low interest rate policy – an unemployment rate above 6.5%, short term inflation “no more than a half percentage point above...2 percent”, and “longer-term inflation expectations continue to be well anchored”. The Fed also reiterated its “balanced approach” towards monetary policy, targeting “maximum employment” as well as “inflation of 2 percent”.
Deleveraging Continues But Consumption Resilient
Consumption growth has been modest in 2012, with personal consumption expenditures (PCE) contributing an average of 1.3% to overall GDP growth in 2012 so far. Still, PCE has remained fairly resilient despite the generally weak economic growth outlook, a high unemployment rate as well as ongoing deleveraging by households. Since 1Q 08, home mortgage debt has been pared down by 10.7% (as of 3Q 12), falling to the lowest level since 1Q 06 (see Chart 5), due in part to foreclosures (and to a certain extent, mortgage forgiveness). On the other hand, consumer credit appears to have turned the corner (Chart 6), while the ongoing recovery in the housing market and home prices should continue to be a positive for consumption.
| CHART 5: MORTGAGE DEBT DECLINING STILL |
 |
| CHART 6: CONSUMER CREDIT HAS TURNED AROUND |
 |
Investment - Corporations Pulling Back But Housing Supports
US recessions in the past have often been accompanied by sharp declines in gross private domestic investment, which is a significantly more cyclical (and volatile) component of GDP as compared to PCE, which tends to be more stable.
| CHART 7: RESIDENTIAL INVESTMENT CONTRIBUTING POSITIVELY |
 |
While the economic recovery from the 2008-2009 downturn was spurred by a reversal in non-residential investment, corporate investment has tapered off in the recent quarter, likely as a result of dampened business sentiment evidenced by the recent declines in CEO confidence (see Chart 8), which has diverged somewhat from the consumer confidence measure. Non-residential investment posted negative quarter-on-quarter growth in 3Q 12, the first decline in 6 quarters, suggesting that corporations are indeed trimming back on capital expenditures on the uncertain global economic outlook, as well as uncertainties brought about by the ongoing “fiscal cliff” debates.
CHART 8: CEOS LESS OPTIMISTIC
|
 |
Offsetting this corporate sector weakness has been residential investment, which has added positively to overall GDP growth for the past 6 quarters (see Chart 9) on the back of rising housing construction activity. Despite the recent improvements, housing starts remain significantly below long-term averages (as well as our estimate of a normalised level of housing activity), while residential investment’s share of the overall US economy still remained at a tepid 2.5% in 3Q 12, significantly below the historical average of about 4.4% (since 1969). We continue to expect the continued normalisation of the US housing sector to support investment in 2013, even as a cloud of conservatism hangs over the corporate sector, although that could change rapidly once the overhang of fiscal uncertainty is removed.
CHART 9: INCREASING IMPACT FROM RESIDENTIAL INVESTMENT
|
 |
WHAT 2013 HOLDS FOR THE US
Headwinds Remain...
Headwinds remain strong for both the corporate and household segments in 2013, with uncertainties over the “fiscal cliff” situation rendering estimates of economic growth rather difficult at present. Even as politicians continue to debate along the lines of higher taxes on the wealthy, it appears increasingly likely that the consumer will feel some sort of negative impact of higher taxes which could hurt spending going into 2013, while weakened corporate investment will likely continue to weigh on overall GDP growth over the near term. Nevertheless, the present consensus forecast of 2.2% full-year growth for 2013 (up from a 1.7% forecast in September 2012) factors in a fair bit of expectation that US politicians will ultimately come to a compromise, thus avoiding sending the US economy “over the cliff” into a deep recession (the Congressional Budget Authority has forecasted -0.5% growth for 2013 should nothing be done). At the time of writing, the situation remains extremely fluid, with the failure of Republicans and Democrats to reach an agreement almost certain to send stock markets lower over the near term.
…But There Are Still Positives To Be Had
Despite the fairly weak outlook, there are still several areas which hold some optimism for the US economy.
First, the housing sector has finally begun to turn around, and in addition to the incremental growth added to US GDP via investment, will likely have indirect positive effects on consumer spending via an increased “wealth effect” as home prices finally begin to rise – this may help to offset some of the pain of higher taxes going into 2013. Also, despite the vast improvements seen in various measures of existing home sales, prices as well as housing construction activity, the recovery in housing has still barely begun, which entails a prolonged period of positive contributions from the sector as it normalises.
Secondly, consumer credit has continued to grow despite the various ongoing concerns, suggesting an improvement in the availability of credit, and also reflecting the improved stability and confidence in the financial sector which has undergone a fairly prolonged period of bad debt write-offs and capital raising. This appears to have had a positive effect on consumption, with quarter-on-quarter (annualised) growth for PCE accelerating modestly from 1.5% in 2Q 12 to 1.6%, despite the worrying external environment coupled with a difficult domestic job market.
Thirdly, the corporate sector continues to be in a strong position, having been able to expand profit margins by cutting costs and hiring cautiously, while being able to refinance or raise debt at fairly competitive rates, aided by the Fed’s suppression of interest rates. Corporate earnings have since risen to record highs (2012 EPS for the S&P 500 is forecasted at 103.43) despite the continued weakness in the global economy, while profit margins should continue to hold steady on conservative hiring and investment, a favourable interest rate environment, as well as minimal tax implications from the “fiscal cliff” situation (which mainly affects households). In addition, we believe that corporate investment (which detracted from 3Q 12 GDP growth) has significant potential to rebound as policy uncertainty is removed going forward, which should add meaningfully to GDP, although later rather than sooner.
NEAR-TERM VOLATILITY, BUT FOCUS ON EARNINGS
The market’s focus on near-term events, albeit one event at a time (Eurozone debt crisis, presidential election uncertainty, fiscal cliff etc.) has resulted in some volatility for US equities, even though 2012 has turned out to be a fairly good year for US stocks – the market has delivered a 13.4% year-to-date return as of 24 December 2012, or 16% when dividends are included (in USD terms). At present, the ongoing fiscal cliff debate appears to have clouded the ability of investors to focus on what ultimately drives stock markets – earnings, leading some to consider the market “overbought” or “overvalued” after the strong run this year. Is that really the case?
CHART 10: EARNINGS DRIVE THE STOCK MARKET
|
 |
As Chart 10 shows, earnings and stocks have had a fairly strong relationship over the past 66 years, with S&P 500 stocks delivering a 7.3% annualised return (excluding dividends) while earnings have grown 7.4% over the same period. As of 26 December 2012, S&P 500 companies are expected to deliver EPS of 103.43 for the whole of 2012, representing another year of record-high earnings (see Chart 11). At the present level of the S&P 500 (1426.66 points, as of 24 December 2012), this represents a valuation of just 13.8X for US stocks, below the 16.3X long-term average, as well as our more-conservative 15X fair value multiple ascribed to the market, and indicates that US stocks remain undervalued, even after their strong performance in 2012 so far.
In addition, S&P 500 earnings in 2013 and 2014 are expected to show further growth (see Chart 11) of 10.5% and 11.3% respectively, while a more conservative forecast of a reversion to a 7% long-term historical rate of earnings growth will still offer investors the opportunity for near-double digit annual returns (7% plus a 2.2% dividend yield). While some near-term volatility is anticipated as investors await more clarity on the “fiscal cliff” situation, 2013 may actually shape up to be a better year for the US economy than many currently expect, and on the back of continued economic and earnings growth (to new record-highs) alongside still-attractive valuations, the US equity market remains well poised to deliver attractive returns over the longer term, which warrants a retention of our 3.5 star “attractive” rating on the market.
CHART 11: RECORD-HIGH EARNINGS
|
 |

